Mobility and GIS solutions for Businesses
Smart and environmentally responsible solutions from Nomadia to analyze, optimize and improve your business profitability.

More than 4,000 companies of all sizes place their trust in us


Based on user feedback on Gartner Peer Insights, Capterra and GetApp. SourceForge Top Performer, Winter 2023.

The leading provider of SaaS Mobility and GIS solutions.
From empowering mobile workforce management to harnessing the power of location intelligence, we provide innovative solutions to drive efficiency and make informed business decisions.
Turnkey solutions that optimize your business processes and helps you to connect your teams and customers.
Perfectly adapted to your specific sector and teams, our solutions are a growth driver for your business.
SaaS Solutions
Discover our SaaS mobility solutions and streamline operations, enhance productivity, and optimize workflows with our innovative and scalable software.
GIS Solutions
Discover powerful GIS solutions: Unlock location intelligence, optimize operations, and make data-driven decisions for business success
Smart solutions to boost your performance.
Scalable, quick to implement and immediately operational, Nomadia solutions cover all the needs of professionals in the field.
![]()
Organization
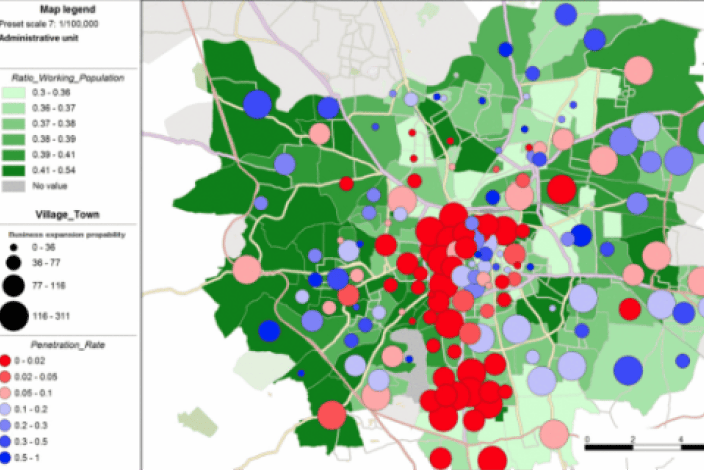
Optimal market analysis and coverage, balanced distribution of teams and resources, realistic and achievable objectives.
![]()
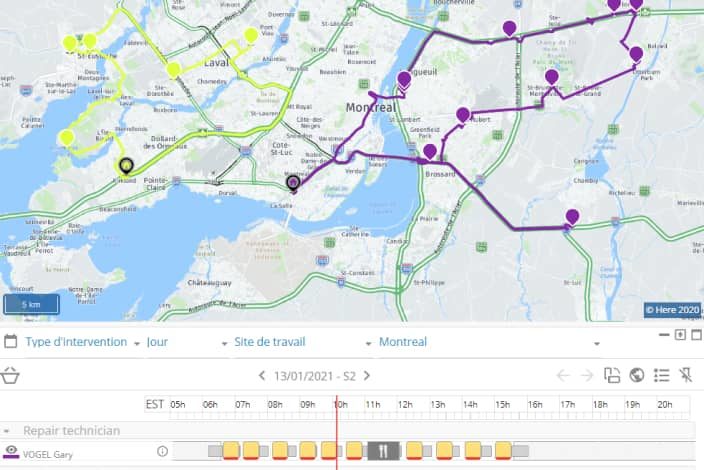
Scheduling
Route optimization, smart scheduling and vehicle assignment, determination of appointment slots by artificial intelligence.
![]()
Execution
Complete mobile applications and terminals adapted to all industries: reporting, order management, ERP interfacing, real-time activity tracking, lone worker protection, ETA, etc.
![]()
Analysis
Business management dashboards, data intelligence, and operational and strategic decision-making tools.
Get our latest news.
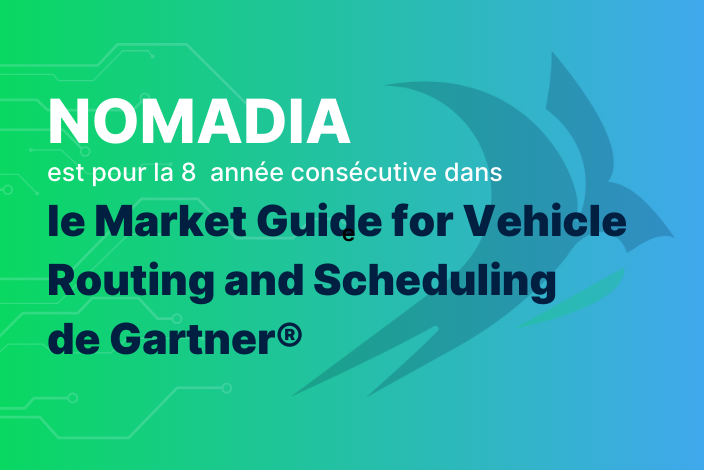
Nomadia has been featured in Gartner®’s Market Guide for Vehicle Routing and Scheduling for the 8th consecutive year
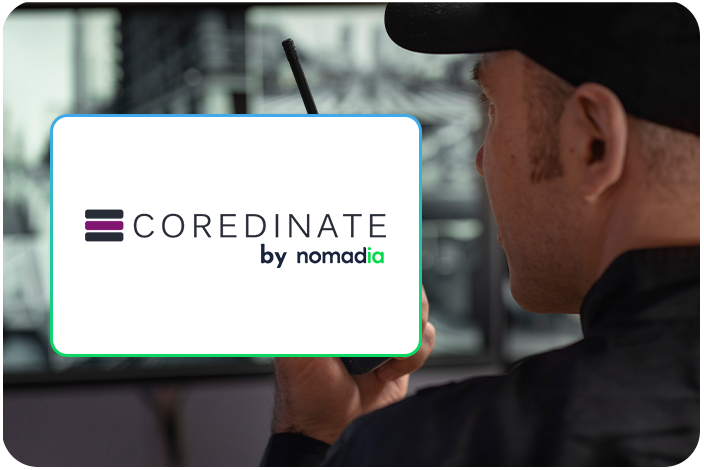
Nomadia Continues its International Expansion with the Acquisition of German Company Coredinate

Nomadia appoints Maxime Dubois as CEO
Any further questions?
You’ll find the answers to our customers’ most frequently asked questions here.
Nomadia is the leading European publisher of SaaS Smart Mobility solutions, guiding more than 175,000 professionals in the field every day. Our solutions are easy to use and quick to roll out, and they guarantee a significant, immediate return on investment.
Combining the expertise of a software integrator / editor with that of a consulting firm, Nomadia’s teams provide you with customized support, from data consulting to the roll-out of mobile terminals. Moreover, our technical support is available 24 hours a day, seven days a week.
Nomadia solutions guide the digital transformation of all types of mobile professionals: traveling sales representatives, delivery drivers, technicians, auditors, healthcare personnel, diagnosticians, service providers, patrolmen, experts, and more.
From small- and medium-sized companies to large corporations, our solutions can be adapted to companies of any size and in any sector.
Each Nomadia solution consists of a ready-to-use SaaS which includes a back office and a mobile business application specially designed for field operations.
Our APIs and their many connectors allow you to integrate our technologies into third-party applications, whether those are custom solutions or market standards.
Our consultant teams can also help you set up a customized solution that is perfectly adapted to your business processes.
Yes! Contact our team to get an evaluation version of the solution of your choice.
As a company committed to the planet, Nomadia naturally asserts a strong CSR (Corporate Social Responsibility) approach. We integrate social, ecological and economic issues into everything we do.
By optimizing the mobility of mobile professionals, our solutions help improve our customers’ productivity, the well-being of their employees, and the impact of their businesses on the environment.
The Nomadia teams are available to answer all your questions:
- via our online form
- by phone at +91 44 43156075